Most of the Software Developers spend 50% of time debugging the code so for efficiency purpose proper Debugging techniques must be employed. Cross Debugging an embedded application can be a complex tasks for many reasons: Real-time Execution, Lack of visibility to the target resources, dependent on the peripherals etc. Due to the above reasons its critical for the developers to use proper debugging tools that can resolve the problem quickly and more efficiently.
In the Real Time Embedded Systems, specifically in the multitasking OS based Implementations on of the challenges is the defect fixing, to resolve the defects the developer must be aware of the flow of the program during the defect or during the faulty condition.
Debugging technique like logging the output during the development build during the software maybe using the instrumentation mechanism (printing the data using the UART Protocol) decreases the overall performance of the system. Another technique is the use of the break-point based debugging features of the processor which in turn slow due to the high number of interruptions. Both techniques are intrusive because they modify the software temporarily for the analysis. This is especially troublesome in the concurrent programs running on multi-core processors or the real time applications as errors due to race conditions or inappropriate timing may be hidden.
For the Non-Intrusive Observation of the tracing, most of the modern Microprocessors features and Embedded Trace Unit which delivers the runtime information to a debug port of the processor in a highly compressed format. A specialized hardware is used to store this debugging data from the processor and store for the analysis.

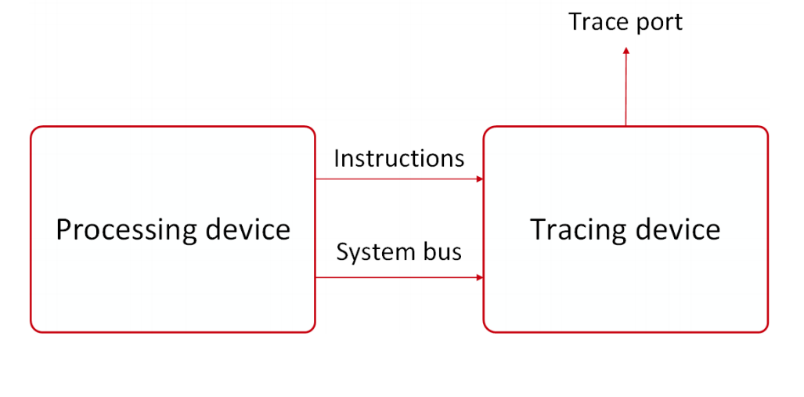
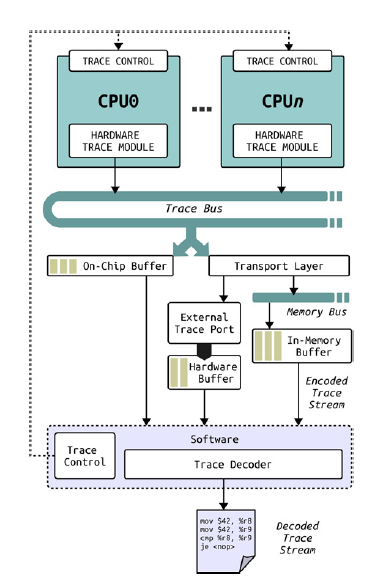 As per the IEEE Standards Hardware Tracing and Debugging features are classified into 4 classes, class 1 must provide with the following features setting up the breakpoints, analyzing registers, stepping instructions and they are transferred through the JTAG. Class 2 supports the capturing and transporting of the program control flow externally to the host devices along with the class 1 features. Class 3 adds the support for the data flow tracing and class 4 allows for the emulated memory and I/O Access though the external ports. So for tracing purpose the SOC must have support for the class higher than 1.
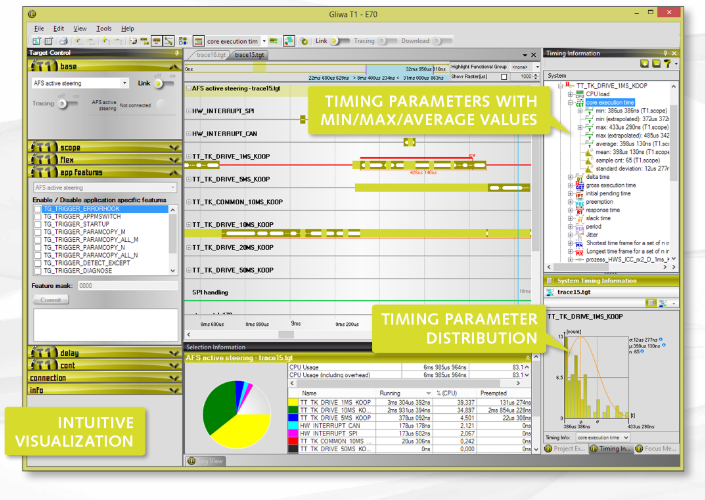
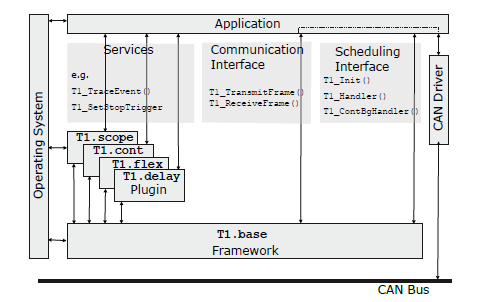 T1.scope is a trace view feature of an T1-host software, it shows the real time behavior by displaying the task time-lines similar to the output of oscilloscope.T1.scope hooks on the OS related events and saves the start time, end time and the related details in a ring buffer.